What is The Non-Linear Forming Limit Diagram?
Contents
In this article, you will have a better understanding of the concept of the forming limit diagram and why this concept is important for stamping simulations. Our team will be sure to answer any questions you may have about stamping simulations in general.
It goes without saying that the primary purpose of any forming simulation is to check how the material behaves prior to building the stamping tool. Originally, the Forming Limit Diagram was a 1965 graduate research project with the aim of determining what triggers localized necking and splitting in sheet metal forming, and whether the splitting could be predicted in advance of an actual failure.
How Does the Forming Limit Diagram Work?
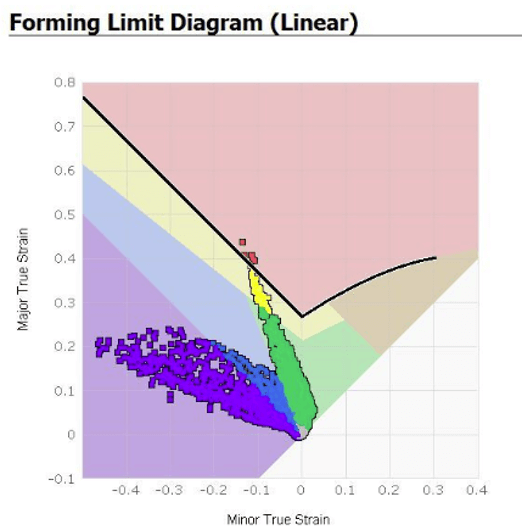
The results produced in a stamping simulation illustrate very clearly the calculated areas of material yielding (splitting), amounts of necking (thinning or changes in thickness) and areas of material compression (wrinkles and folds). The Forming Limit Diagram (FLD) is key to analyzing this data as it plots each element’s strain (in major and minor axis) on a graph and compares it to the material’s limits to determine if any of these defects will be present. With this information in hand, countermeasures and adjustments can be made to the die face design and then the stamping simulation can be re-run, until each defect is removed or an acceptable result is achieved.

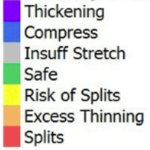
The Forming Limit Diagram on it’s own does not determine failure. Plotted on the FLD, is also a Forming Limit Curve which is unique for each material type and thickness. Once the strains are plotted on an FLD, failure is considered to be certain if the plotted strain is above the Forming Limit Curve. The Forming Limit Curve is primarily determined by the “n value” and the thickness of a given material.
Virtual Circle Grid Plots – Old School FLD?
It used to be common practice for a toolmaker to scribe or etch a grid of circles onto a blank during the tooling development stage. Then, the etched blank is put in the near-finished tool (or proto tool) and the sheet metal is formed. As the forming takes place, each circle (which was perfectly round with known diameter, when it was etched onto the blank) stretches according to how much strain is experienced at that point, as determined by the shape of the part and properties of the blank material.
Often a toolmaker will study the deformed circle pattern to gain an understanding as to how the material is behaving in order to assist with solving a forming problem such as wrinkling or splitting. With this information, an informed judgment can be made as to what changes should be made to the tooling to solve the problem. This is also the basis of a Forming Limit Diagram. At each of these points, the strain (or amount of stretch) can be measured in two directions, commonly known as the major and minor axis. Then each value is plotted on the FLD to determine if the amount of straining is beyond the limits of the materials or not.
So this means the FLD basically replaces a circle grid plot, right? Not entirely. Whilst the FLD is an excellent tool to show strains all over the part, sometimes it is difficult to see which point in the part corresponds to which point on the FLD, in reality. The circle grid plot allows the point in question to be directly related to the point on the part, since the circle is etched on the part itself. The Forming Limit Diagram is more commonly used in simulation analysis, whereas Circle Grid Plots are more useful on the shop floor.
Many toolmakers may also prefer to study a circle grid plot rather than an FLD diagram but ideally, both a circle grid plot and an FLD should be studied together to get the best understanding of how the material is behaving during the forming process.
Furthermore, a virtual circle grid plot can be compared to an actual circle grid plot to determine the accuracy of the forming simulation or to simply confirm that the forming simulation is accurate. In fact, this is the basic method for verifying that forming simulation does in fact yield realistic results. Thankfully, it has been done to death already and proven that forming simulation does predict accurate results, provided the simulation is performed correctly and realistic parameters are used.
Find a Forming Simulation Expert
However, for your own satisfaction, you may wish to confirm a virtual circle grid plot against an actual circle grid experiment in your own tool room.
Of course, Stamping Simulation can provide a virtual circle grid plot with the results of any forming simulation we perform, upon request, alongside the Forming Limit Diagram.
Contact StampingSimulations with any questions you may have about FLD.